For over a century, the Panama Canal has been a vital artery of global commerce, a marvel of engineering that severed continents to stitch the world’s markets together. But in recent years, this critical waterway has faced unprecedented challenges. From severe droughts impacting the Panama Canal transit schedule to fluctuating wait times, the stability of Panama Canal shipping is no longer a guarantee—it is a complex variable that every logistics manager must solve. At MyDello, we believe that logistics should be simple, transparent, and efficient. Whether you are shipping goods from Asia to the US East Coast or managing a global supply chain, understanding the Panama Canal current status is critical. This comprehensive article explores the canal’s rich history, its immense importance, the root causes of its current constraints, and the future of its role in global trade.
Are your shipments facing delays due to global chokepoint congestion? MyDello simplifies logistics by comparing rates and transit times across air, sea, and rail instantly. Don’t let uncertainty disrupt your supply chain.
Create Your No-Cost Account Today and experience the New Era of Logistics
To understand the current complexities of the canal de panama, we must first look back at the monumental effort required to build it. The dream of connecting the Atlantic and Pacific oceans dates back to the early 16th century, but it wasn’t until the late 19th century that technology and political will aligned.
The initial attempt was led by the French in 1881, spearheaded by Ferdinand de Lesseps, the architect of the Suez Canal. However, the French effort collapsed under the weight of financial scandal and the devastating toll of tropical diseases like malaria and yellow fever, which claimed an estimated 20,000 lives.
The United States took over the project in 1904, following Panama’s independence from Colombia—a political maneuver heavily supported by President Theodore Roosevelt. The US construction effort was a triumph of engineering and public health. By controlling mosquito populations and utilizing an ingenious lock-and-lake system, the project succeeded where the sea-level approach had failed. On August 15, 1914, the cargo ship SS Ancon became the first vessel to officially transit the canal, forever changing global trade routes.
For decades, the panama channel remained under US control, a point of geopolitical tension that was eventually resolved by the Torrijos-Carter Treaties in 1977. On December 31, 1999, full control of the waterway was handed over to Panama. Since then, the most significant milestone was the completion of the “Expanded Canal” in 2016. This $5.25 billion project added a third lane of locks to accommodate massive “Neopanamax” container ships, ensuring the canal’s relevance in an era of mega-vessels.
The Panama Canal significance to global trade cannot be overstated. Before the canal, a ship traveling from New York to San Francisco had to navigate the treacherous Cape Horn at the southern tip of South America, a journey of nearly 21,000 kilometers (13,000 miles). The canal reduced this voyage to just 8,370 kilometers (5,200 miles), saving weeks of travel time and massive amounts of fuel.
Today, the canal serves as a critical shortcut for over 140 maritime routes connecting more than 1,700 ports in 160 countries. Its primary value lies in facilitating the “All-Water Route” from Northeast Asia to the US East Coast. For retailers and manufacturers, this route is often more cost-effective than shipping to the US West Coast and using more expensive rail and truck transport to cross the country. This is why the Panama Canal is important.
The canal handles a diverse array of cargo, from containerized consumer goods to bulk commodities like grain and coal, and energy products like Liquefied Natural Gas (LNG). In fact, the US is one of the largest users of the canal for exporting its agricultural products and LNG to Asian markets. Any disruption here sends shockwaves through the global economy, raising freight rates and delaying inventory for businesses worldwide.
Historically, the Panama Canal traffic has accounted for approximately 3-5% of total global maritime trade by volume. In a typical year, the waterway sees between 13,000 and 14,000 vessel transits. However, recent years have seen significant volatility due to environmental constraints.
The fiscal year 2024 (October 2023–September 2024) was particularly challenging. According to official data from the Panama Canal Authority (ACP), total transits plummeted as a result of the drought. Daily transit slots, which normally hover around 36-38, were slashed to as few as 18 in early 2024.
This Panama Canal traffic decline was not uniform across all sectors. While container ships—which often book slots months in advance—maintained a degree of priority, other sectors like dry bulk carriers and LNG carriers saw massive declines. LNG transits, for instance, dropped dramatically as carriers sought more reliable routes to avoid the Panama Canal backup.
For logistics planners, the key question is often: “how long does it take to cross the panama canal?” The answer requires distinguishing between the physical Panama Canal transit time and the total waiting time.
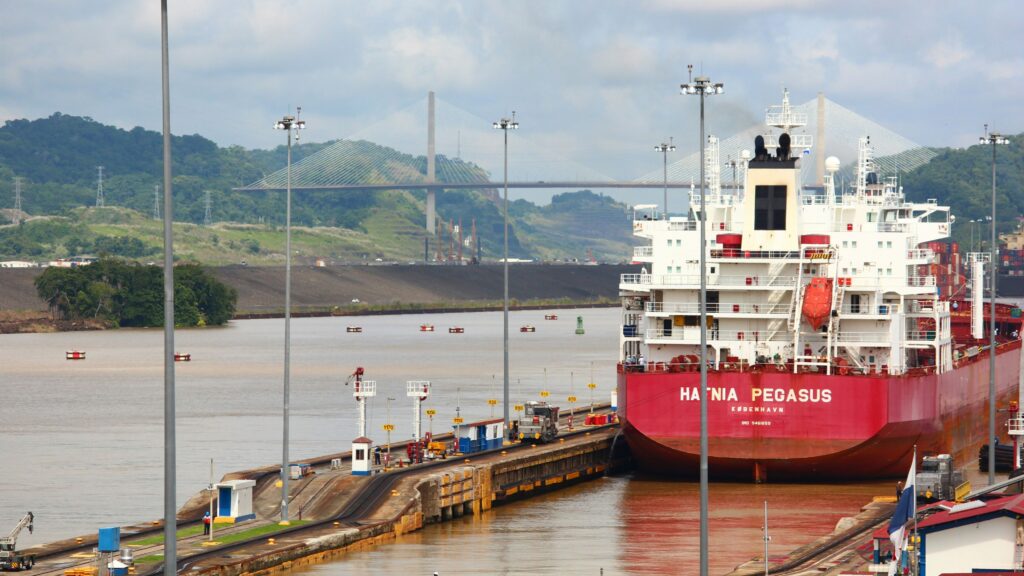
The actual passage through the 82-kilometer (51-mile) canal takes between 8 to 10 hours. During this Panama Canal full transit, a ship enters a series of three locks (Miraflores, Pedro Miguel, and Gatun), which use over 100,000 tons of fresh water per chamber to raise the vessel 26 meters (85 feet) above sea level to the surface of Gatun Lake. The ship then traverses the Continental Divide before being lowered back down to sea level on the other side.
The real challenge in recent years has been the queue. In normal conditions, a ship might wait 24 to 48 hours. However, during the height of the 2023-2024 drought, the Panama Canal wait time for vessels without reservations skyrocketed. At its peak, the Panama Canal traffic jam saw over 160 ships waiting, with some facing delays of up to 21 days. This is why following the Panama Canal backlog news today is critical for shippers.
The cost is complex and based on the vessel’s type and size. A standard Panamax vessel might pay between $100,000 and $400,000 in Panama Canal fees. During periods of heavy congestion, the ACP auctions off “skip-the-line” slots. In late 2023, shippers reportedly paid auction premiums as high as $4 million, in addition to the standard tolls, just to secure a slot. A simple Panama Canal fees calculator does not exist; tolls are determined by the ACP’s detailed tariff structure.
The recent Panama Canal traffic decline is driven by a convergence of environmental and operational factors. The root causes include:
The Panama Canal drought that began in 2023 is the most severe operational threat the waterway has faced in its history. When did the Panama Canal drought start becoming a crisis? The situation escalated in mid-2023 when the El Niño climate phenomenon led to one of the driest years on record in Panama.
How does drought affect Panama Canal operations?
When the Panama Canal became congested, global supply chains adapted. Shippers and freight forwarders began utilizing alternative shipping routes.
The future of the Panama Canal will depend on its ability to manage water resources. If reliability cannot be restored, these alternative routes may become permanent fixtures in global logistics strategies.
Navigating these complex route options can be overwhelming. MyDello acts as your digital logistics partner, helping you find the best route—whether it’s the Panama Canal, the Cape, or a multimodal combination.
Create Your No-Cost Account Today and experience the New Era of Logistics
The Panama Canal remains a vital artery for global trade, but it is no longer the invincible shortcut it once was. The combination of the severe Panama Canal drought, fluctuating Panama Canal transit time, and rising fees has forced the logistics industry to become more agile and data-driven.
Your key takeaways are:
By staying informed and leveraging modern logistics tools, you can navigate even the most challenging waters and keep your supply chain moving.
The Suez Canal is one of the most critical arteries in the body of global commerce. For over 150 years, it has served as the shortcut that powers the world economy, linking the manufacturing hubs of the East with the consumer markets of the West in a way that defines modern logistics. However, recent years have proven that this vital waterway is not immune to disruption.
From the infamous grounding of the Ever Given to the complex geopolitical tensions of the 2023-2025 Red Sea crisis, the stability of this route directly correlates with the predictability of global supply chains. When Suez Canal shipping is disrupted, the entire world feels the impact through higher costs and longer delivery times.
This comprehensive guide will provide a deep dive into the canal’s history, its immense importance, and its operational mechanics. We will analyze the Suez Canal traffic news today 2025, break down the costs and delays caused by recent crises, and look ahead at what Suez Canal news today 2026 might hold for shippers worldwide.
Ready to navigate the complexities of global shipping? At MyDello, we make logistics simple, transparent, and stress-free. Whether you are routing through the Suez or around the Cape of Good Hope, our digital platform finds you the best options instantly.
Create Your No-Cost Account Today and experience the New Era of Logistics
The story of the Canal de Suez is a story of human ambition rewriting geography to serve commerce. While the modern canal officially opened in 1869, the dream of connecting the Mediterranean Sea to the Red Sea is ancient, with early canals constructed by Egyptian pharaohs centuries ago.
The modern canal was the culmination of a decade-long construction project orchestrated by French diplomat Ferdinand de Lesseps. Before its existence, ships traveling between Europe and Asia were forced to navigate the treacherous and incredibly lengthy route around Africa’s Cape of Good Hope. The canal’s opening was a revolution, instantly shrinking the world for maritime trade.
However, its strategic importance has also made it a focal point of conflict and a barometer of global power shifts.
These incidents underscore a recurring theme: when Suez Canal shipping stops, the world takes notice.
You might ask, why is the Suez Canal important to international shipping? The answer lies in the simple, brutal mathematics of time, distance, and money. The canal offers the shortest maritime route between Asia and Europe, eliminating the need to circumnavigate Africa.
Without this waterway, the global economy would face permanently higher shipping costs, slower deliveries, increased inventory carrying costs for businesses, and greater environmental impact from longer voyages. This is why the Suez Canal is so important to international shipping.
To understand the scale of operations, we must look at how much shipping goes through the Suez Canal.
In 2023, before the peak of the Red Sea crisis, the canal saw record-breaking traffic, with over 26,000 vessels transiting, and generated revenues of over $10 billion for Egypt. This answers the question of how many ships pass through the Suez Canal daily: in normal conditions, it is between 50 and 60 vessels.
However, Suez Canal traffic news paints a very different picture due to the geopolitical instability in the Red Sea.
For logistics managers, the practical question is always: how long does it take to transit the Suez Canal?
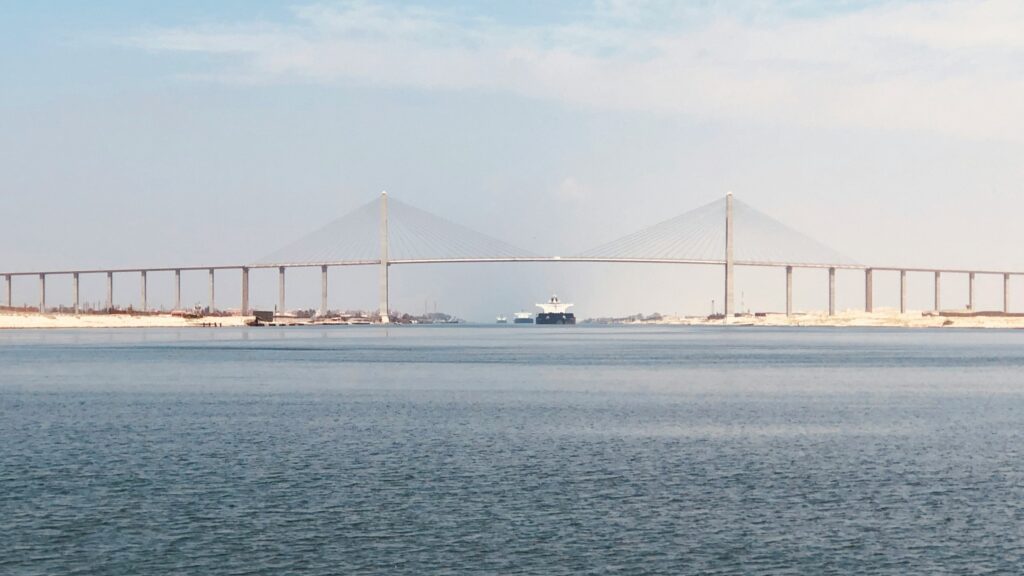
Under normal operations, the passage through the 193-kilometer (120-mile) canal takes between 11 and 16 hours. However, the process is highly structured.
The cost of this convenience is substantial. Suez Canal transit fees are a major operational expense, often running into hundreds of thousands of dollars for a single large container ship. The fees are calculated based on a complex formula using the “Suez Canal Net Ton” (SCNT) and the type of vessel. In response to the traffic decline, the SCA has offered significant discounts (up to 75% in some cases) throughout 2024 and 2025 to entice carriers to return, a key topic in Suez Canal transit news today.
No discussion of Suez Canal shipping is complete without mentioning the event that captivated the world. In March 2021, the Suez Canal blockage caused by the container ship Ever Given became a global phenomenon.
The 400-meter-long “megaship” lost steering amidst high winds, wedging itself diagonally across the canal and completely obstructing the waterway. The Suez Canal ship stuck for six agonizing days. The knock-on effects were catastrophic:
Fast forward to late 2023. The Suez Canal crisis of this period was not an accident but a geopolitical event. Attacks on commercial vessels in the Bab-el-Mandeb Strait by Houthi militants forced the world’s largest shipping lines—including Maersk, MSC, and Hapag-Lloyd—to make a difficult choice: risk the Red Sea or divert around Africa.
The vast majority chose to divert. This decision, dominating Suez Canal shipping news today 2025, has had profound effects:
For shippers planning for 2026, the key lesson from the Suez Canal crisis is that supply chain resilience requires flexibility and real-time visibility.
Don’t let global disruptions slow your business down. MyDello’s digital platform provides real-time visibility and alternative routing options. Whether it’s the latest Suez Canal news or a new challenge, we help you adapt instantly.
Create Your No-Cost Account Today and experience the New Era of Logistics
The Suez Canal is more than just a waterway; it is a critical chokepoint and a powerful barometer for the global economy. From its storied history to its role in modern trade efficiency, Suez Canal shipping remains a vital topic for any business moving goods across borders.
As we move towards 2026, the key takeaways are clear:
Staying informed on Suez Canal shipping news allows you to make smarter, more proactive decisions. With a digital partner like MyDello, you gain the visibility and flexibility needed to navigate these uncertain waters with confidence, ensuring your cargo arrives on time, every time.
In the world of global trade, predictability is power. Whether you are shipping electronics from Asia to Europe or sourcing materials from China for the US market, knowing when your goods will arrive is crucial for managing inventory, cash flow, and customer expectations. However, calculating an accurate ocean freight transit time can often feel like navigating through a fog.
At MyDello, our mission is to make logistics simple and straightforward for everyone. This comprehensive guide will cut through the complexity. We will provide you with the latest 2025 data on the world’s busiest shipping routes, explain the major delay factors impacting transit times today, and give you a clear, actionable formula to calculate your shipping timelines with confidence.
Stop guessing your arrival dates. Get instant, real-time ocean freight quotes and accurate, door-to-door transit time estimates with MyDello’s digital platform today. Compare all your options in seconds.
Create Your No-Cost Account Today and experience the New Era of Logistics
To calculate a realistic freight transit time, you must understand that “shipping time” is not just the time a vessel spends at sea. The transit time meaning in logistics refers to the entire door-to-door process, which involves a series of coordinated steps.
Here is a timeline of the typical journey your cargo takes:
Understanding this full lifecycle helps businesses distinguish between the simple transit time between ports and the actual time it takes for goods to be ready for sale.
The volume of goods moving across the oceans in 2025 highlights the critical nature of specific trade lanes and chokepoints.
This remains a critical artery for global trade, linking the Indian Ocean to the Pacific. According to the World Economic Forum, approximately one-third of global trade passes through this strait, making it vital for Asia-Europe and Intra-Asia shipping.
Traditionally the fastest route for Asia-Europe trade. However, as reported extensively by major news outlets and logistics publications throughout 2024 and 2025, geopolitical instability has forced many carriers to avoid this route, dramatically impacting transit times.
A key corridor linking Asia to the US East Coast. Persistent drought conditions have forced the Panama Canal Authority to reduce the number of daily vessel transits. This has created bottlenecks, although recent rainfall has slightly improved the situation as of mid-2024.
The year has been defined by volatility. While freight rates saw a significant decline from their pandemic-era highs due to softer consumer demand and an oversupply of new vessels, the Red Sea crisis caused a dramatic spike in early 2024. As of mid-2024, rates have begun to stabilize but remain higher than pre-crisis levels. Carriers continue to use “blank sailings” (canceling voyages) to manage capacity, which can unpredictably extend freight transit time if your container gets rolled to a later ship.
Estimating how long a container ship from China to the US or EU will take requires a formula that accounts for more than just the sailing schedule. A reliable ocean transit time calculator methodology must consider the total door-to-door journey.
Total Transit Time = First/Last-Mile Trucking + Port Handling (Origin & Destination) + Port-to-Port Transit + Buffer Time
Below are the average ocean transit times for popular trade lanes in 2025. Note that these are port-to-port estimates; always add time for handling and a buffer.
| Route | Average Transit Time (Port-to-Port) | Notes for 2025 |
| China to US West Coast | 18 – 25 days | A relatively stable and direct route. |
| China to US East Coast | 30 – 45 days | Longer due to Panama Canal transit or alternative routing. |
| China to Northern Europe | 35 – 50 days | Extended by 10-14 days due to widespread rerouting around Africa to avoid the Red Sea. |
| China to Mediterranean | 30 – 45 days | Heavily impacted by Suez Canal avoidance. |
| Europe to US East Coast | 15 – 25 days | A stable and reliable transatlantic route. |
Note: For LCL (Less than Container Load) shipments, always add an additional 5-7 days for the consolidation and deconsolidation processes at both ends.
Even the best-planned shipments can face hurdles. In 2025, several major disruptions have affected the estimated transit time ocean freight reliability.
Navigating 2025’s logistics landscape requires more than just booking a slot on a ship. It demands a partner who can optimize your ocean freight transit time strategies.
Working with a digital logistics expert like MyDello offers clear benefits:
Ready to bring clarity and predictability to your ocean freight? Sign up for MyDello now to access our global network, real-time tracking, and instant quoting tools.
Create Your No-Cost Account Today and experience the New Era of Logistics
Calculating ocean freight transit time in 2025 is an exercise in managing reality. While the port-to-port sailing time is a major factor, your total freight transit time is heavily influenced by first- and last-mile handling, customs clearance, and major global disruptors.
By understanding the full timeline, building buffers into your schedules, and leveraging a digital partner like MyDello to provide visibility and flexibility, you can build a more resilient and predictable supply chain.
In the world of international logistics, rail freight is the strategic “middle ground”—significantly faster than sea freight and far more cost-effective than air freight. For businesses moving goods across the vast Eurasian landmass or within North America, rail offers a compelling balance of speed, cost, and reliability.
But how long does rail freight take? Calculating an accurate rail freight transit time in 2025 requires navigating a complex web of evolving routes, busy border crossings, and geopolitical factors. A simple “terminal-to-terminal” estimate is no longer enough.
At MyDello, our mission is to make logistics straightforward. This guide will provide you with the latest 2025 data, a clear formula for calculating your true door-to-door shipping timeline, and the strategic insights needed to leverage rail freight as a competitive advantage.
Stop guessing your shipping times. Get instant, real-time rail freight quotes and accurate, door-to-door transit estimates with MyDello’s digital platform today. Compare Rail vs. Sea vs. Air in seconds.
Create Your No-Cost Account Today and experience the New Era of Logistics
The transit time meaning in logistics is the total duration of a shipment from origin to destination. For rail freight, this is much more than just the time spent on the train. To understand the total freight transit time, you must consider the entire door-to-door lifecycle.
Here is the typical timeline for a rail shipment in 2025:
Rail freight volumes in 2025 reflect a year of strategic shifts. Geopolitical factors and infrastructure investments have reshaped the most critical corridors.
This remains the most established and fastest land bridge between China and Europe due to its mature infrastructure.
Also known as the Trans-Caspian International Transport Route (TITR), this route bypasses Russia and has seen explosive growth.
To get an accurate delivery date, you cannot rely solely on the “terminal-to-terminal” or port to port shipping transit time. A reliable rail transit time calculator methodology must account for the entire door-to-door journey.
Total Transit Time = First-Mile Time + Rail Haul Time + Border/Transshipment Buffer + Last-Mile Time
Step-by-Step Guide:
Pro-Tip: Always ask your logistics partner if their quote is “Terminal-to-Terminal” or “Door-to-Door.” The difference can be over a week.
Below are the estimated rail freight transit times for popular trade lanes in 2025, reflecting typical door-to-door durations.
| Route | Average Transit Time (Door-to-Door) | Notes for 2025 |
| China to Northern Europe (e.g., Germany, Poland) | 22 – 28 days | The “Northern Route.” Fastest and most predictable land option. |
| China to Southern Europe (via Middle Corridor) | 30 – 40 days | A strategic alternative, but slower due to multiple sea transfers. |
| China to US (Intermodal via West Coast) | 25 – 35 days | This answers “how long does a container shipment from China to the US take?” via sea + rail. Includes ocean freight to a port like Los Angeles, plus rail transit to inland hubs like Chicago. |
| Intra-Europe (e.g., Spain to Germany) | 4 – 7 days | Highly reliable and sustainable for cross-border EU trade. |
| US Cross-Country (e.g., Los Angeles to New York) | 8 – 12 days | The “land bridge” alternative to the Panama Canal. |
While generally more reliable than sea freight, rail is not immune to disruptions. Understanding these helps in planning.
Rail logistics is intricate. You need a partner who can navigate gauge changes, handle complex customs documentation across multiple borders, and pivot instantly if a bottleneck appears.
Why choose a digital partner like MyDello?
Ready to make rail freight a strategic advantage for your business? Sign up for MyDello today to access our global rail network, get instant quotes, and experience the future of simplified logistics.
Create Your No-Cost Account Today and experience the New Era of Logistics
In 2025, rail freight is a vital strategic option for global trade, offering a powerful balance between the high cost of air and the long transit time of ocean freight. However, accurately calculating the rail freight transit time requires a door-to-door approach that looks beyond simple terminal-to-terminal schedules.
By understanding the key routes, accounting for first- and last-mile transport, and building in buffers for border crossings, you can create a predictable and resilient supply chain. With a digital partner like MyDello, you have the expertise and technology to make that happen seamlessly.
In the complex world of global trade, speed is money. When choosing a shipping method for urgent, high-value, or time-sensitive goods, air freight stands out as the fastest option available. But how long will your cargo actually take to arrive?
Understanding and accurately calculating your air freight transit time is critical for managing inventory, meeting deadlines, and keeping customers satisfied. A simple flight schedule doesn’t tell the whole story; the total journey is a multi-step process where delays can easily occur.
At MyDello, we believe logistics should be straightforward. This guide will demystify the mechanics of air cargo, provide you with the latest 2025 market data, and give you a comprehensive formula for calculating your precise shipping timeline. Stop guessing your arrival dates. Get instant, real-time air freight quotes and accurate, door-to-door transit time estimates with MyDello’s digital platform today. Compare all your options in seconds.
Create Your No-Cost Account Today and experience the New Era of Logistics
The transit time meaning in logistics refers to the total duration of a shipment from origin to destination. For air cargo, this is much more than just the flight itself. To calculate a realistic freight transit time, you must understand the entire door-to-door process.
Here is a timeline of the typical journey your cargo takes:
While an express courier can sometimes deliver door-to-door in 1-3 days, a standard air freight shipment, accounting for all these steps, typically takes 5 to 12 days in total.
Global trade volumes in 2025 reveal which air corridors are experiencing the highest demand, giving insight into where capacity and price fluctuations are most likely.
According to the latest industry data from IATA (International Air Transport Association), global air cargo demand has shown strong growth in 2024, a trend continuing into 2025. Key trade lanes driving this growth include:
The volume passing through key airports directly influences local freight transit time. Based on the latest full-year data from Airports Council International (ACI), the world’s top cargo hubs continue to be:
| Rank | Airport (IATA Code) | Location | Primary Role |
| 1 | Hong Kong International (HKG) | Hong Kong, China | Global gateway for electronics and e-commerce. |
| 2 | Memphis International (MEM) | Memphis, USA | World hub for FedEx Express. |
| 3 | Shanghai Pudong (PVG) | Shanghai, China | Key node for high-value manufacturing exports. |
| 4 | Ted Stevens Anchorage (ANC) | Anchorage, USA | Strategic trans-Pacific refueling and transfer stop. |
When demand surges at these hubs, such as during the Q4 peak season, airport congestion can lead to delays, and airlines may “roll” cargo to a later flight.
To accurately predict when your goods will arrive, you need a formula that accounts for all pre- and post-flight processes. A simple flight schedule is not enough.
Total Transit Time = First/Last-Mile Trucking + Handling (Origin & Destination) + Airport-to-Airport Transit + Buffer Time
Using a professional air freight transit time calculator from a digital partner like MyDello automates this process, providing a much more reliable estimate.
Below are the average door-to-door transit times for popular air freight trade lanes in 2025.
| Route | Average Transit Time (Door-to-Door) | Notes for 2025 |
| China to USA | 7 – 12 days | Includes major hubs like Shanghai (PVG) to Los Angeles (LAX) or Chicago (ORD). |
| China to Europe | 6 – 10 days | Connects manufacturing centers to key European hubs like Frankfurt (FRA) and Amsterdam (AMS). |
| Europe to USA | 5 – 9 days | A stable and high-frequency transatlantic route. |
| Intra-Asia | 3 – 5 days | Connects major hubs like Hong Kong (HKG), Singapore (SIN), and Seoul (ICN). |
Note: These are estimates for standard air freight. Express courier services can be significantly faster (1-4 days) but at a much higher cost.
While air freight is the fastest mode, it is not immune to disruptions. Understanding these common delay factors is key to realistic planning.
Navigating the complexities of air cargo—from booking space on the right airline to ensuring flawless customs documentation—requires deep expertise. A digital freight forwarder like MyDello provides clear advantages:
Ready to bring clarity and predictability to your air freight? Sign up for MyDello now to access our global network, real-time tracking, and instant quoting tools.
Create Your No-Cost Account Today and experience the New Era of Logistics
Calculating air freight transit time is about understanding the entire door-to-door journey, not just the flight schedule. The total delivery time is influenced by ground handling, customs clearance, and global market conditions.
Your key takeaways are:
The holiday season is the most demanding time of the year for global supply chains. For any business importing goods or shipping products to customers, ensuring delivery before Christmas is the final, high-stakes test of your logistics strategy. The pressure is immense, and the margin for error is zero.
However, the chaos of peak season can be managed with proactive planning and the right technology. This guide will serve as your strategic playbook. We will cover the essential Christmas shipping deadline dates you must know, break down the root causes of shipping delays, and provide actionable strategies to keep your cargo moving smoothly
It’s crunch time. If you have urgent cargo, don’t guess the costs. Get an instant, all-in quote on the Mydello platform now and see your options for Air, Sea, and Rail immediately.
Create Your No-Cost Account Today and experience the New Era of Logistics
If you want your packages delivered by December 25th, you must adhere to the carrier cutoffs. Large shipping companies like USPS, UPS, and FedEx announce holiday shipping deadlines for 2025 well in advance, and these dates are non-negotiable.
Below are the projected shipping dates for Christmas 2025 for domestic U.S. routes. Remember, these are the recommended last days; shipping earlier is always the safest strategy.
USPS Holiday Deadlines for 2025
FedEx Holiday Deadlines for 2025
UPS Holiday Deadlines for 2025
If you have missed the Christmas shipping deadlines for standard domestic ground transport, your only remaining option is expedited air freight or express courier services. While more expensive, they are the only way to guarantee shipping before Christmas at this late stage.
Even if you meet the last day for Christmas shipping, shipping delays can still occur. Understanding the reasons for shipping delays is key to mitigating them.
As recent shipping delays holiday 2025 news has shown, these factors combine to create a volatile environment where delays are the norm, not the exception.
While you can’t control the weather, you can control your logistics strategy. Here is how to minimize the risk of Christmas shipping delays.
Many businesses struggle because they try to manage the complexity of peak season logistics alone. This is where a digital freight forwarder provides a decisive advantage. Here is how freight forwarding reduces shipping delays:
Ready to build a resilient supply chain for 2026 and beyond? Don’t let logistics be a bottleneck. Experience the future of freight forwarding with MyDello’s powerful platform and expert support.
Create Your No-Cost Account Today and experience the New Era of Logistics
The shipping deadlines for Christmas 2025 are the final, critical hurdle of the year for any logistics manager. By understanding the cutoff dates for USPS, FedEx, and UPS, and by anticipating the root causes of delays, you can make informed decisions to keep your supply chain moving.
Your key takeaways are:
Once the holiday rush ends, the cycle begins again with Chinese New Year 2026. Stay ahead of the curve, keep your documentation in check, and partner with a logistics provider that makes Christmas shipping simple.
For logistics managers and supply chain planners, the start of the calendar year is always dominated by one major event: the Chinese New Year. As the most significant holiday in the manufacturing world, it brings production to a halt and creates a unique and intense set of challenges for global shipping.
With the Year of the Snake (2025) behind us, we are rapidly approaching the Chinese New Years 2026. This period is notorious for extreme rate spikes, severe capacity crunches, and disruptive “blank sailings.” However, with the right preparation and a digital logistics partner like MyDello by your side, you can navigate these turbulent waters smoothly and turn a potential crisis into a competitive advantage.
This comprehensive guide will cover everything you need to know to master the 2026 Chinese new year. We will detail key dates, analyze the impact on freight, and provide a strategic survival guide for your supply chain.
Don’t let the annual holiday rush disrupt your business. Gain a strategic advantage by planning your shipments with MyDello’s expert team and transparent digital platform.
Create Your No-Cost Account Today and experience the New Era of Logistics
The date of the Lunar New Year changes annually because it is based on the lunisolar calendar. So, when is lunar new year 2026?
The Chinese New Years 2026 date falls on Tuesday, February 17, 2026.
While the official public holiday lasts for one week (February 17th to February 23rd), the true disruption to manufacturing and logistics is significantly longer.
Every year is associated with one of the twelve zodiac animals. The 2026 chinese new year animal is the Horse, specifically the Fire Horse. In Chinese culture, the Horse represents energy, speed, and relentless forward momentum. For logistics professionals, this is a fitting symbol—you will need to move fast and stay agile to keep your cargo moving during this high-pressure season.
The impact of the Chinese lunar new year 2026 is a multi-phase event that creates a ripple effect across global supply chains.
Weeks before the Lunar new year 2026 date, a frantic rush begins as importers scramble to get their orders shipped out of China before factories close. This massive surge in demand leads to:
During and immediately following the holiday, shipping lines announce “blank sailings.” This means they cancel entire voyages on major trade lanes because there is no new production coming out of factories to fill the ships. This tactic allows carriers to manage capacity and maintain high freight rates, but it can cause significant delays for any cargo left at the port.
Resilience during the 2026 chinese new year is not about reacting; it’s about proactive planning. Here are three essential strategies to protect your supply chain.
Contact your suppliers in Q4 2025. Confirm their exact closure dates and their final production deadlines for pre-CNY shipment. This information is more important than the official public holiday dates. Using clear delivery terms is crucial; review our Guide to Incoterms to ensure both you and your supplier are aligned on responsibilities.
Analyze your sales data and forecast the inventory you will need to cover a production gap of at least 3-4 weeks. It is far safer to hold slightly higher stock levels in your local warehouse than to risk a stockout while Chinese factories are closed and shipping schedules are in chaos.
The “Golden Rule” of Chinese New Year shipping is to book early. We recommend securing your space at least 4 to 6 weeks before your desired departure date.
It is a common and costly misconception that China only shuts down for one week. The manufacturing freeze is much longer due to the human element of the holiday.
The Chinese lunar new year 2026 is the most important time for family reunions in China. Hundreds of millions of workers travel from industrial cities back to their rural hometowns.
This means you must plan for a total production shutdown of 3-4 weeks, not 7 days.
When ocean freight capacity tightens and rates spike around the Chinese New Year, leveraging alternative logistics modes can save your supply chain.
MyDello’s platform aggregates real-time data from air, sea, rail, and road carriers, giving you the flexibility to compare and switch modes instantly based on the unique pressures of the 2026 chinese new year.
Ready to build a resilient supply chain for 2026? Experience the future of freight forwarding with MyDello’s powerful platform and expert support.
Create Your No-Cost Account Today and experience the New Era of Logistics
The Chinese New Year is a predictable disruption, yet it catches many businesses off guard every year. By marking the Chinese new years 2026 date—February 17th—on your calendar and understanding the full 3-4 week scope of the shutdown, you can take proactive steps to protect your supply chain.
The key takeaways are:
With the right preparation, you can navigate the Year of the Horse with speed and confidence, keeping your inventory safe and your customers happy.
For any business sourcing from Asia, the Chinese New Year is the single most significant planned disruption to the global supply chain. Knowing the exact date is just the beginning; understanding its true impact on manufacturing and freight is essential for keeping your business running smoothly.
This guide will provide the clear, actionable intel you need. We will cover the specific Chinese new years 2026 date, detail how the holiday will affect your shipping, and outline the true duration of the disruption so you can plan effectively.
Don’t let the annual shutdown disrupt your business. Mydello’s platform and expert team help you plan around the Chinese New Year in 2026 for seamless, predictable shipping.
Create Your No-Cost Account Today and experience the New Era of Logistics
The Chinese New Year 2026 date is Tuesday, February 17, 2026.
This event, also known as the Lunar New Year or Spring Festival, marks the beginning of the new year on the traditional Chinese lunisolar calendar. Unlike the Gregorian New Year on January 1st, the lunar new year 2026 date is determined by the moon’s cycles.
The 2026 Chinese new year animal is the Horse. This is a major cultural event and an official public holiday in China, leading to the world’s largest annual human migration as workers return to their hometowns for family reunions.
The impact of the 2026 Chinese New Year on global logistics cannot be overstated. Businesses must prepare for a three-phase disruption:
In the weeks leading up to when is Chinese New Years 2026, a massive surge in manufacturing and freight bookings occurs as businesses rush to ship goods before the country closes. This “pre-CNY rush” causes two major problems:
During the holiday period, factories and manufacturing facilities across China will completely shut down. This production halt is the primary cause of logistics delays. It’s essential to plan your inventory levels to account for this multi-week pause in production.
The disruption doesn’t end on the official holiday date. It takes time for factories to resume full production as workers slowly return from their hometowns. This slow ramp-up period leads to continued production backlogs and shipping delays.
Mydello’s Strategic Tip: To avoid delays and unexpected costs, coordinate with your suppliers and book your shipments at least 4-6 weeks before the Chinese lunar new year 2026. Proactive planning is the key to simplifying your logistics.
This is the most critical piece of information for logistics planning. While the official holiday is one week, the real disruption is much longer.
Do not base your planning on the one-week official holiday. Use the wider 6-to-8-week window for realistic scheduling.
The Chinese New Year is complex, but your logistics don’t have to be. Partner with Mydello to build a resilient supply chain that anticipates and navigates annual disruptions with ease.
Create Your No-Cost Account Today and experience the New Era of Logistics
The 2026 Chinese New Year presents a critical, but predictable, challenge for global supply chains. By understanding the date (February 17), planning for the full 6-to-8-week disruption window, and anticipating the pre-holiday rush, your business can significantly mitigate the risk of delays and higher costs.
The key takeaway is simple: proactive planning is the only way to successfully manage the Chinese New Year. At Mydello, our goal is to provide the tools and expertise to make that planning straightforward and effective.
Your international shipment has arrived at the border, but it’s not moving. The reason? An incorrect or missing commodity code. This single number is the key to unlocking your cargo’s journey, and getting it wrong is one of the most common and costly mistakes in global trade.
Performing an accurate HS code lookup is a non-negotiable step for any business that imports or exports goods. This code dictates duties, taxes, and regulatory requirements, making it the foundation of a smooth customs clearance process.
This guide will provide you with a straightforward, practical toolkit for classifying your products correctly. We will walk you through the best official government databases and explain how to use them to find the right code, every time.
Create Your No-Cost Account Today and experience the New Era of Logistics
A commodity code lookup is the process of identifying the correct Harmonized System (HS) code for your product. This code is a global standard that tells customs authorities exactly what you are shipping. An accurate HS tariff code is essential for determining the correct import duties.
It’s important to distinguish between two types of tools:
For a successful HS code lookup, you should rely on official, government-run sources. These are the databases used by customs authorities themselves.
Here is Mydello’s essential toolkit of official lookup portals:
Some countries publish their entire tariff schedule as a single, comprehensive HS code list. These master documents, typically in PDF format, contain every commodity code and its corresponding duty rate. While incredibly detailed, they can be challenging for beginners to navigate.
Here are a few example links to the official lists for several major trading nations:
A quick search online will reveal numerous third-party websites and services offering HS code lookups and customs calculations. While some may appear user-friendly, we at Mydello advise caution and the use of official government resources where possible.
These commercial tools are not the official, governmental source. Their data could be outdated or inaccurate, and using a code from one of these sites could still result in fines if it is incorrect. Additionally, many operate on a “freemium” model, providing limited information to upsell you to a paid subscription.
Our official recommendation: Use third-party tools for preliminary research only. Always verify your final commodity code using the official government database of the importing country.
Create Your No-Cost Account Today and experience the New Era of Logistics
An accurate HS code lookup is not just an administrative task; it’s a critical component of your company’s risk management and financial planning. Getting it right ensures your supply chain remains efficient and predictable.
Your key takeaways are:
The information contained in this blog article is accurate as of the publishing date and is liable to change. Contact MyDello’s expert team to get the most up to date information about customs duties.
In the fast-moving world of global trade, few terms are as important—and as frequently misunderstood—as the tariff. Whether you’re an e-commerce entrepreneur, a multinational manufacturer, or a curious consumer, tariffs directly affect the cost of goods and your bottom line.
A tariff is far more than just a tax. It is a powerful economic and political tool that governments use to shape international relationships, protect domestic industries, and generate revenue. Misunderstanding them can lead to crippling, unexpected costs that can derail a business.
This comprehensive guide will demystify the concept. We will break down the essential tariff meaning, clarify who is responsible for paying them, and examine the critical reasons behind their implementation.
Create Your No-Cost Account Today and experience the New Era of Logistics
The clearest tariff definition is: a tax imposed by a government on goods and services imported from other countries. When a product crosses an international border, the local customs authority levies this tax, which increases the product’s cost within the importing country’s market.
But how does a tariff work in practice? The process is a core part of customs clearance. The tax is typically calculated in one of three ways:
It’s important to distinguish tariffs from other trade barriers. While a tariff is a tax, a quota is a limit on the quantity of a good that can be imported, and a sanction can be a complete ban on trade. Tariffs are an explicit and traceable cost, making them a transparent, albeit impactful, method of managing international trade.
This is the most common point of confusion. A widespread misconception is that the exporting country “pays” the tariff. This is incorrect.
In virtually all scenarios, the importer of the goods is legally responsible for paying the tariff to the customs authority of their own country.
For example, if a U.S.-based company imports furniture from Vietnam, that U.S. company (the Importer of Record) is obligated to pay the tariff to U.S. Customs and Border Protection.
However, the legal responsibility is different from the economic burden. Once the importer pays the tariff, that cost doesn’t just disappear. It is typically passed on in one of three ways:
This cost-transfer mechanism was clearly demonstrated during the recent China Tariff actions, where the U.S. imposed significant tariffs on Chinese goods. While U.S. importers paid the duties, extensive research from organizations like the Tax Foundation shows that this cost was largely passed on to American businesses and consumers through higher prices.
Governments impose tariffs for a blend of economic, political, and strategic reasons. The purpose of a tariff can be categorized into three main roles: Revenue, Protection, and Leverage.
Historically, tariffs were a primary source of government funding. Today, this revenue is still significant. This answers the question, “where does tariff money go?” When an importer pays a tariff, the money is collected by the customs authority and deposited into the national treasury, contributing to the general fund used for public services, infrastructure, and other government operations.
This is the most well-known purpose of a tariff. By raising the price of imported goods, tariffs make domestically produced alternatives more competitive. This strategy, known as protectionism, is designed to:
In modern geopolitics, tariffs are a powerful negotiation tool. A country may threaten or impose a tariff to pressure a trading partner into changing policies related to intellectual property, human rights, or environmental standards.
Conversely, tariffs are also used for retaliation. If one country imposes tariffs, the affected nation often responds with its own, creating a “trade war” that can escalate costs and disrupt supply chains globally, a topic closely monitored by institutions like the International Monetary Fund (IMF).
Create Your No-Cost Account Today and experience the New Era of Logistics
At the heart of global trade lies the tariff, a complex tool with significant financial implications. For any business involved in importing, understanding its dynamics is essential.
Staying informed about tariffs—from standard duties to special rates applied during trade disputes like the China Tariff actions—is not just good practice; it is essential for survival and growth. Partnering with a knowledgeable logistics provider like Mydello transforms this complex challenge into a seamless part of your international strategy.
The information contained in this blog article is accurate as of the publishing date and is liable to change. Contact MyDello’s expert team to get the most up to date information about customs duties.